
Begin with a Daily Brief
See the most relevant actions and concerns before opening individual tools.
The Polar Founder Dashboard brings together the signals an owner needs without turning the business into a wall of charts. It focuses on priorities, momentum, customers, money and actions that can be understood and used.
A worked daily dashboard example
Imagine Sophie opens Polar on Monday morning. She has customer work to follow up, money still owed and jobs to prepare. The figures below are a fictional working example, separate from the product screenshots.
After the actions: Sophie records the received payment, updates customer responses and marks completed preparation tasks. She then reviews the changed picture. The dashboard is most useful when the working records behind it are current.
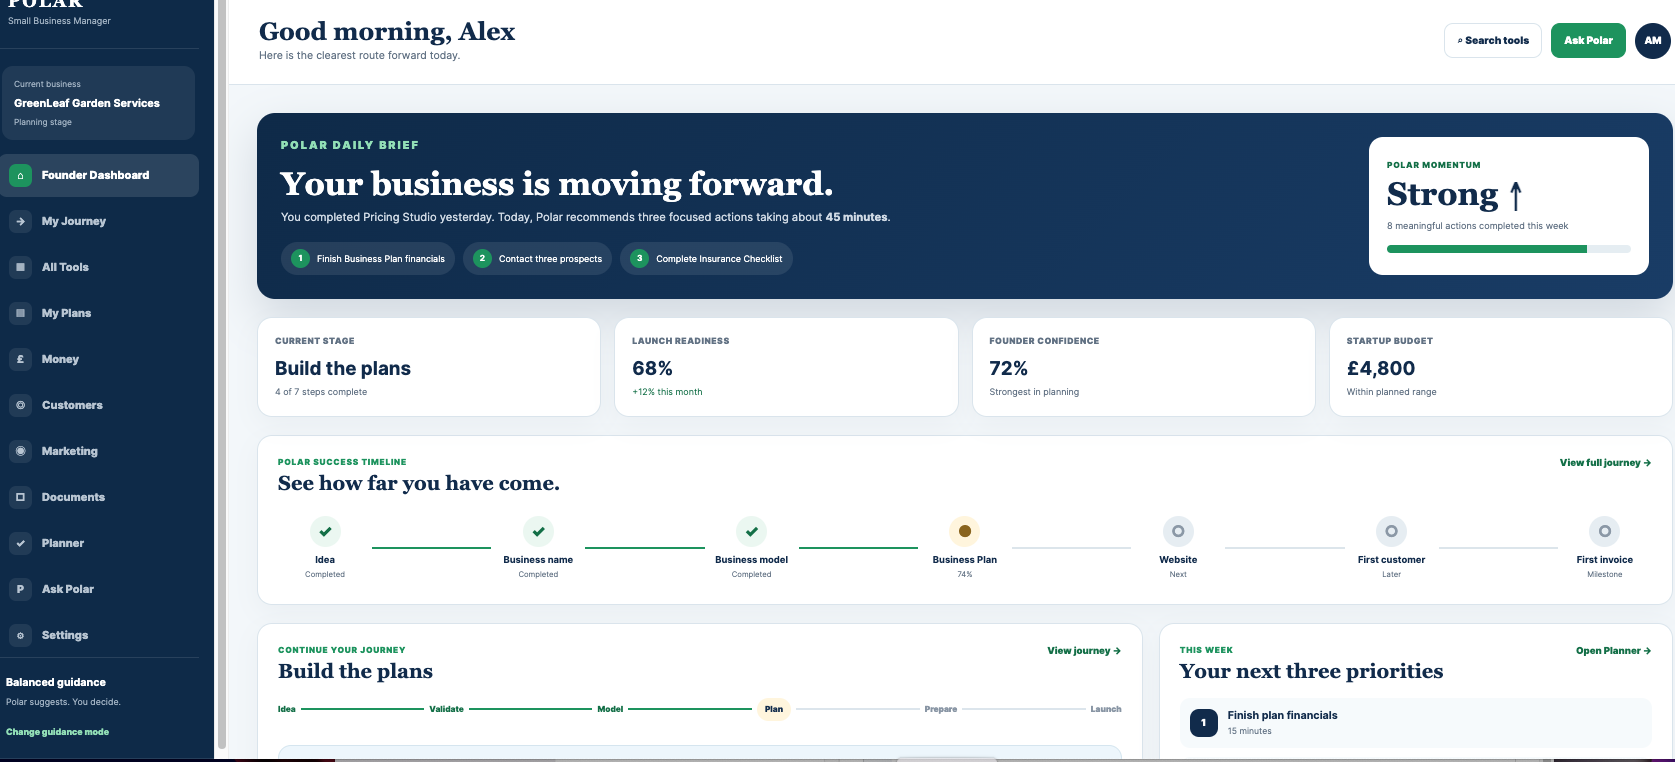
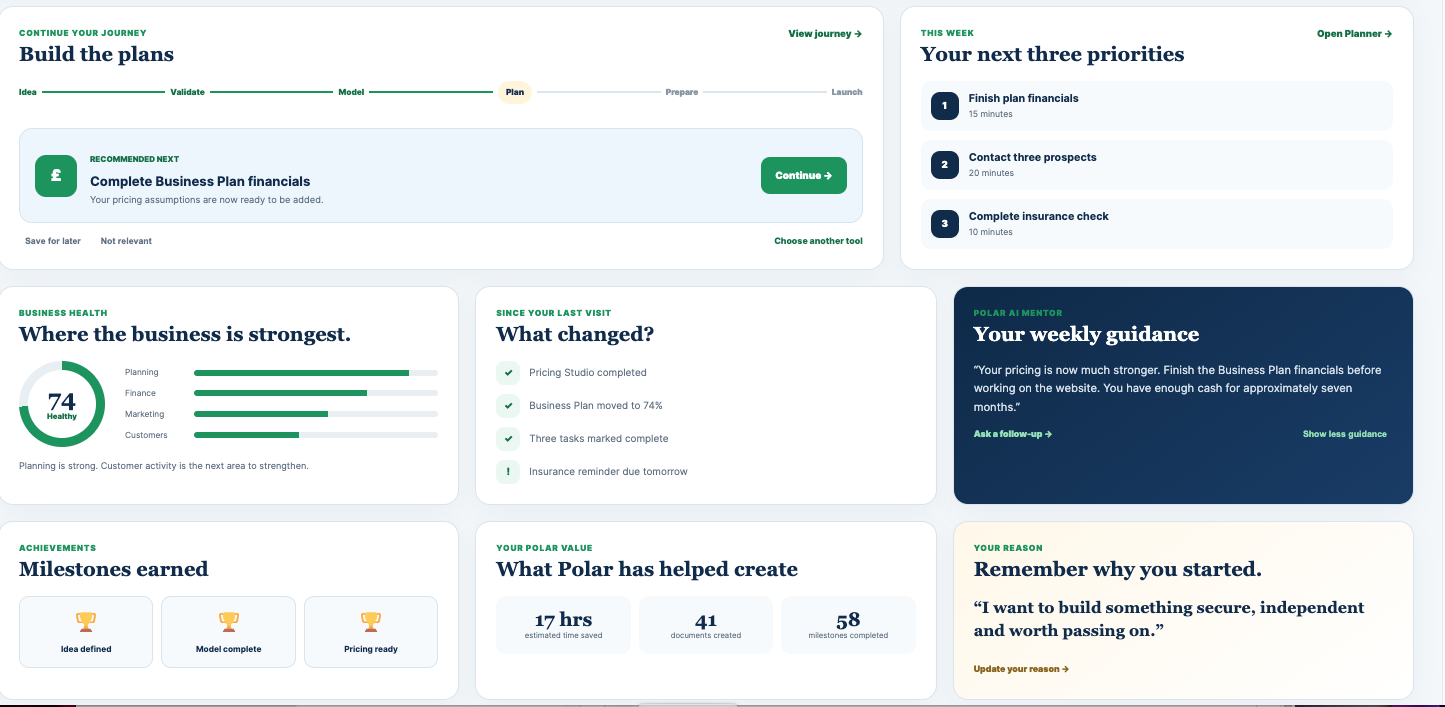
Start with the information that changes a decision: what customers need, what money is owed, what work is committed and which actions matter now. Open the relevant record to check the detail. A historical report can then help explain patterns across a longer period.
A useful dashboard should reduce uncertainty, not display every available metric. Polar organises information around the owner’s questions: What needs attention? What has changed? What is moving? What should happen next?
See the most relevant actions and concerns before opening individual tools.
Follow milestones, business health and momentum rather than vanity activity.
Move from a headline signal into the customer, money or planning detail behind it.
Use Polar’s customer, money, planning and operating tools.
Check what changed and what needs attention.
Open the relevant workspace and complete the next useful action.
A busy owner may see money in the bank and assume the month is healthy, while overdue invoices, unfinished quotes and supplier commitments tell a different story. Polar’s dashboard brings the useful signals together so the owner can spot what needs attention before opening five separate tools.
Only the information that helps you act: priorities, customer movement, cash pressure, sales progress and operational warnings.
A dashboard shows the current picture quickly. A report explains a period, pattern or decision in more detail.
No. Polar highlights evidence and priorities; the business owner remains in control.